Another Day of Range Bound Trading ... !!!
The Nifty futures opened flat on the expiry day of the of the July month contracts. As the market didn't break the Wednesday's lows convincingly, the market tried to test the highs of the previous trading range between 5360 and 5410. It was also supported by the opening of the European markets in the positive territory. The futures recorded a high of 5415 in the after noon session and closed at 5408.75. As this blog has repeatedly been disclosing, it seems that the sell indicated by the Momentum Signal may not have much effect since the market is still trading in the narrow trading range. ( Quote from the last post : " However, as already stated in the previous posts, this sell signal will be confirmed by the market action only if the market breaks the 5350 levels. "
Nifty Futures - Daily Chart

Since the Nifty future has broken the black support line, it may become the resistance line immediately. However, Nifty future is still trading above its support at 5350-5360 levels. The daily trading ranges have also become very narrow these days. The lower panel of the above chart shows the various ATR values of the front month Nifty futures in percentage value. It can be seen from the chart that the Thursday's trading range is one of the narrowest ones seen recently. The 5 ATR has also been recording new recent lows.So long as the rally continues, the market may record narrow daily trading ranges with occasional spurts.
World Markets
The following the daily chart of the US Dow Jones Index. The index seems to be retracing from a double top at present. ( See the upper panel of the chart. )
US Dow Jones Index - Daily Chart

The lower panel of the chart shows the various daily moving averages. It is seen that the Dow Jones index is facing trading just above it's 200 DMA and is facing resistance from it's 100 DMA. The last time it reached these levels it corrected 4 %. In case the DJIA is able to trade above the 10,600 levels it may augment the present rally in the Indian markets to new highs. If this scenario takes place, the Nifty Index may test it's overhead resistance at the 5500 to 5550 area.
Even though the European stock indices spent most of the trading day in the positive territory, the markets there finished with moderate losses in the end. The FTSE, CAC and DAX closed with losses of 0.11, 0.50 and 0.72 percents respectively. The US stock indices too opened in the positive territory and soon recorded losses on the back of the comments on the US economy made by James Bullard, the president of the Federal Reserve Bank of St. Louis. He warned that the American economy may get “enmeshed in a Japanese-style deflationary outcome within the next several years.” The US stock indices were trading with moderate losses of 0.2 to 0.50 % at 00.00 HRS IST.
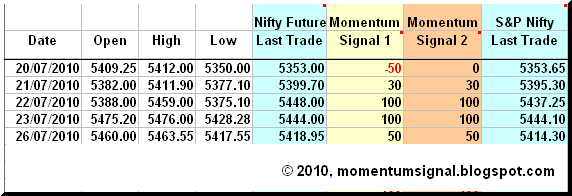
Updated Momentum Signal Spreadsheet

The above spread sheet is prepared using the current month future's last traded price. However, it seems that if the values of August futures were used, the system would have shown a neutral value. The Sensex, however closed in the sell area on Thursday.
Projected Momentum Signal Close Values
The projected levels Momentum Signal values applicable to various ranges of closing values of the Nifty Futures, Nifty Index and the BSE Sensex, as at the close of next trading day, ie. as on 30th July, 2010, are given in the following table.

Please click on the table to enlarge. For more info on the above table, please click here.
As the Momentum Signal is primarily a trend following system, it may indicate whipsaw signals in range bound markets. As such, all readers of this blog are requested to read the various pages describing the system and understand all the intricacies of trading the Momentum Signal and it's risk factors too. Please do write in your comments and suggestions.
Cheers and Prosperous Investing and Trading !!!
To access and/or download the free online Position Limit Calculator click here.
To checkout the five year history of The Momentum Signal Spreadsheet click here.
To access and/or download the free online Position Limit Calculator click here.
To checkout the five year history of The Momentum Signal Spreadsheet click here.
© 2010, momentumsignal.blogspot.com All rights reserved.
Disclaimer: No research, information or content contained herein or in the accompanied spreadsheet shall be construed as advice and is offered for information purposes only. We shall not be responsible and disclaim any liability for any loss, liability, damage (whether direct or consequential) or expense of any nature whatsoever which may be suffered by the user or any third party as a result of or which may be attributable, directly or indirectly, to the use of or reliance on any information or service provided. All files/information is provided 'as is' with no warranty or guarantee as to its reliability or accuracy.